
Why SolarEdge Stock Is Cheap and Could Double
Marijuana Business, Stocks, Finance, & Investing November 12, 2018 MJ Shareholders 0

SolarEdge Technologies Looks Like a Bargain
The solar industry is alive and growing despite the rhetoric from President Donald Trump and his continued belief that climate change may not be due to humans.
The United States exited the Paris Agreement on climate change, placed major tariffs on imported solar panels, and is looking to cut credits to green projects.
But I doubt that Trump will want to wreak havoc with the alternative energy space given the hundreds of thousands of good-paying jobs at stake.
The solar sector has undergone a renaissance—reducing debt and restructuring operations to produce a more streamlined and efficient operating model.
A small-cap solar play that offers investors a great risk-to-reward trade is Solaredge Technologies Inc (NASDAQ:SEDG), which is down 45% from its 52-week high in May 2018 despite strong growth in revenue, earnings, and free cash flow (FCF).
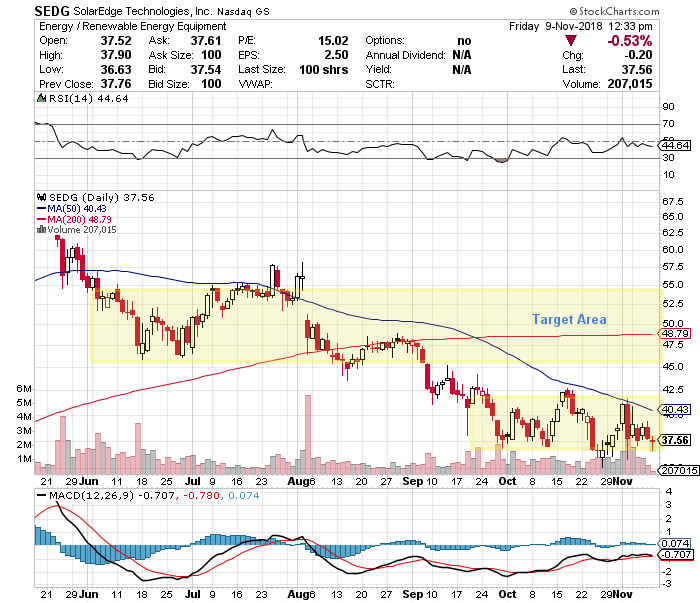
Chart courtesy of StockCharts.com
SolarEdge stock is trading in a sideways base after the sell-off but appears to have found some support.
Look for a rally back to the previous trading range above $45.00.
What makes SolarEdge intriguing is that the company doesn’t manufacture solar panels but instead focuses on providing integrated solutions that convert and optimize solar energy to AC power. The company also offers monitoring and storage solutions.
SolarEdge sells to residential, commercial, and small utilities in over 100 countries.
My Bullish Thesis for SEDG Stock
As I said earlier, SolarEdge is growing its key fundamental metrics to the point where the potential is not currently accounted for in the share price.
The revenue picture for the company shows sequential growth in four straight years, with revenues surging from $79.1 million in 2013 to $607.1 million in 2017. The compound annual growth rate (CAGR )during this time was an impressive 66.5%.
| Fiscal Year | Revenue (Millions) | Growth |
| 2013 | $79.0 | |
| 2014 | $133.2 | 68.6% |
| 2015 | $325.1 | 144% |
| 2016 | $480.0 | 47.7% |
| 2017 | $607.0 | 26.5% |
(Source: “SolarEdge Technologies Inc.,” MarketWatch, last accessed November 9, 2018.)
For 2018, SolarEdge is estimated to produce revenue growth of 52.1% to $923.3 million, followed by growth of 16.2% to $1.1 billion. (Source: “SolarEdge Technologies, Inc. (SEDG),” Yahoo! Finance, last accessed November 9, 2018.)
The decline in the revenue growth rate for SEDG stock is not a major concern at this point, as this is what I would expect when the revenue base is undergoing strong growth.
SolarEdge has managed to expand its gross margins in four consecutive years, which indicates cost control.
| Fiscal Year | Gross Margins |
| 2014 | 16.4% |
| 2015 | 25.2% |
| 2016 | 31.0% |
| 2017 | 35.4% |
(Source: MarketWatch, op cit.)
Furthermore, SolarEdge has increased its earnings before interest, tax, depreciation, and amortization (EBITDA) in four straight years, producing positive EBITDA from 2015 to 2017.
| Fiscal Year | EBITDA (Millions) | Growth |
| 2013 | -$24.6 | |
| 2014 | -$15.28 | 38% |
| 2015 | $31.0 | 303% |
| 2016 | $72.6 | 134% |
| 2017 | $99.3 | 37% |
(Source: Ibid.)
Generally accepted accounting principles (GAAP) diluted earnings is positive and increased in four straight years, including $1.85 per diluted share in 2017 and $2.43 on an adjusted basis.
| Fiscal Year | GAAP Diluted EPS | Growth |
| 2013 | -$0.72 | |
| 2014 | -$0.55 | 24.1% |
| 2015 | $0.27 | 149.4% |
| 2016 | $1.16 | 329.6% |
| 2017 | $1.85 | 59.5% |
(Source: Ibid.)
SolarEdge is expected to ramp up its adjusted earnings by 33% to $3.24 per diluted share in 2018, followed by some softening to $3.21 per diluted share in 2019. (Source: Yahoo! Finance, op cit.)
Another positive sign is the lack of any debt for SolarEdge, which is impressive and much more to due to its business model. The company holds almost $350.0 million in cash. (Source: Ibid.)
SolarEdge has also been generating positive FCF, with growth in four straight years.
| Fiscal Year | Free Cash Flow (Millions) | Growth |
| 2013 | -$24.7 | |
| 2014 | -$20.8 | 15.5% |
| 2015 | $0.3 | 101.4% |
| 2016 | $38.1 | 13,074% |
| 2017 | $115.3 | 202.8% |
(Source: MarketWatch, op cit.)
Analyst Take
In my view, the fundamentals and growth are not currently reflected in the price of SolarEdge stock.
The irony is the rather large short position of almost 10.0 million shares or 23.7% of the float. I think the short sellers are wrong on about this stock and that a rally will drive short-covering support.
SolarEdge trades at an attractive 12.8 times its 2019 consensus EPS. The price/earnings to growth (PEG) ratio of 0.58 is extremely cheap and indicates that SEDG stock trades at well below its estimated compound annual growth rate (CAGR) for earnings. Discount in the cash, and the PEG is even more attractive.
MJ Shareholders
MJShareholders.com is the largest dedicated financial network and leading corporate communications firm serving the legal cannabis industry. Our network aims to connect public marijuana companies with these focused cannabis audiences across the US and Canada that are critical for growth: Short and long term cannabis investors Active funding sources Mainstream media Business leaders Cannabis consumers


No comments so far.
Be first to leave comment below.