
This Suggests That Price Support for CGC Stock Is Fast Approaching
Marijuana Business, Stocks, Finance, & Investing October 29, 2018 MJ Shareholders 0

CGC Stock: Failed Signals Are Powerful Indications
The market conditions are far from stellar. To be honest, they are quite atrocious. The month of October has not been kind to stocks, and I fear that this is only the beginning of a very large correction.
This recent round of selling pressure that has plagued the market has been accompanied by a number of bearish indications. For instance, price patterns that normally have bullish outcomes have been failing.
Failed patterns are a hallmark indication that a stock has reached a significant inflection point, with violent reactions usually occurring as a result.
This brings me to the reason why I am focusing on Canopy Growth Corp (NYSE:CGC). On October 15, Canopy Growth stock completed a technical price pattern that was implying that future higher prices were likely. You can view this pattern in the chart below:
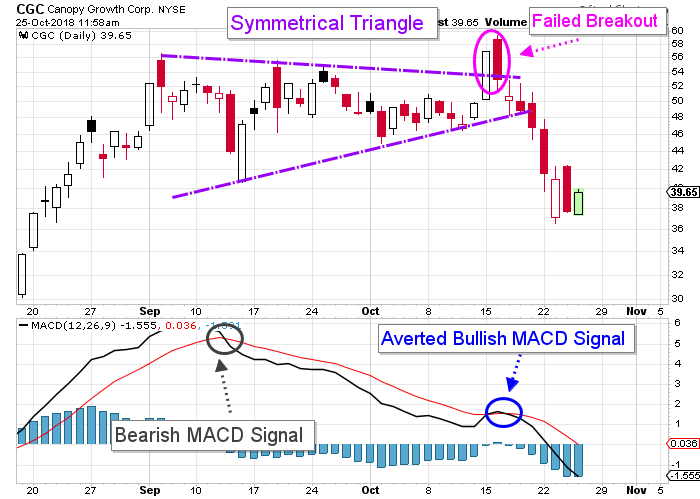
Chart courtesy of StockCharts.com
The pattern highlighted here is a “symmetrical triangle.” On average, these act as constitution patterns, with the price action that causes this pattern creating the necessary conditions so the stock can sustain another move higher.
That is why this pattern had so many appearance on Canopy Growth Corp’s stock chart over the years, as its bull market remained in development.
This current triangle looked just like all the other triangles that preceded it. Everything seemed normal while it was in development; even the moving average convergence divergence (MACD) indicator was in bearish alignment.
To quickly clarify for those who do not frequent my work, MACD is a momentum indicator that determines whether bullish or bearish momentum is influencing the price action in a stock.
In a bullish trend, when a stock is staging an advance, it is being influenced by bullish momentum, and while it is correcting, it is being influenced by bearish momentum.
On October 15, CGC stock closed at $56.89, which completed the symmetrical triangle. This close was also accompanied by a bullish MACD signal. All the aforementioned necessary signals to suggest a developing higher price movement were there.
The next day, on the 16th, Canopy Growth stock started on the right foot. It opened higher by 4.2%, and then the sell-off began; by day’s end, CGC stock was down by 6.8%. This sell-off negated all the signals that were created the day previous. The stock price closed back within the pattern and the bullish MACD signal was averted.
These signals clearly had failed. Failed signals are powerful indications, which is why violent reactions tend to follow. This time was no exception, and the next day, selling pressure continued to mount. Over the span of seven trading days, CGC stock shed 33.9% of its value.
A considerable amount of technical damage has been done in the sell-off. it has also occurred in the aftermath of legalization in Canada.
This was an anticipated event, and once again milestone events like this one have proven to be selling events. The old adage of buying on rumor, and selling on news continues to ring true.
There is some solace for the bulls, there is a level of price support that is fast approaching, as seen in the chart below:
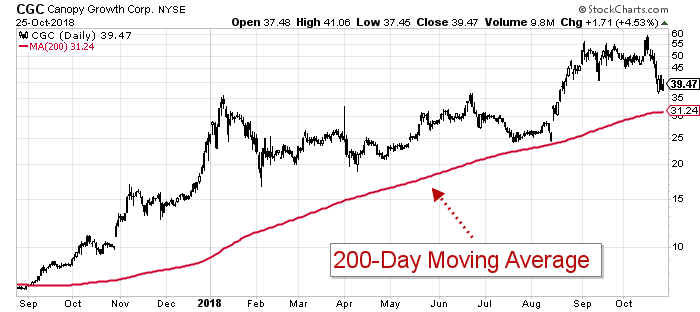
Chart courtesy of StockCharts.com
This CGC stock chart contains the 200-day moving average.
The 200-day moving average acts like a dividing line that distinguishes a stock that is trading in a bullish state from one trading in a bearish state. In September 2017, Canopy Growth stock broke back above this metric and has been trading there ever since.
This metric has a habit of behaving as a significant level of price support in bull markets. And if this bull market has some life left in it, CGC stock needs to maintain its footing above it.
Analyst Take
Canopy Growth stock experienced a failed breakout last week, and a violent move toward lower prices has followed. Given the current market environment, I have to believe that a significant top has just been put in, with reduced prices likely to prevail.
MJ Shareholders
MJShareholders.com is the largest dedicated financial network and leading corporate communications firm serving the legal cannabis industry. Our network aims to connect public marijuana companies with these focused cannabis audiences across the US and Canada that are critical for growth: Short and long term cannabis investors Active funding sources Mainstream media Business leaders Cannabis consumers


No comments so far.
Be first to leave comment below.