
The Bullish Trend in ORHOF Stock Has Likely Run Its Course
Marijuana Business, Stocks, Finance, & Investing December 31, 2018 MJ Shareholders 0

ORHOF Stock Needs to Regain Its Footing Above Price Support
It’s hard to believe that a few short months ago, the markets were forging new all-time highs. But now, we are on pace for the worst December since the Great Depression.
The selling pressure that has hit the market since early October has left a trail of carnage, where little to no sectors have been sparred.
The favored marijuana stock sector that was shining so bright heading into October, on the heels of legalization in Canada, has also lost its luster. The titans that lead this sector higher have all succumbed to the selling pressure. I am sorry to say, but this sector looks primed for further losses.
Even CannaRoyalty Corp (OTCMKTS:ORHOF, CNSX:OH), which was the last of the aforementioned titans that was able to forge a new all-time highs following legalization (in early November), has also succumbed to the selling pressure.
ORHOF stock has fallen below key levels of price support, suggesting that the bullish trend that was so kind to investors over the past 20 months has finally come to an end. As a result, the door has swung wide open for further losses.
One of these key levels of price support is captured below:
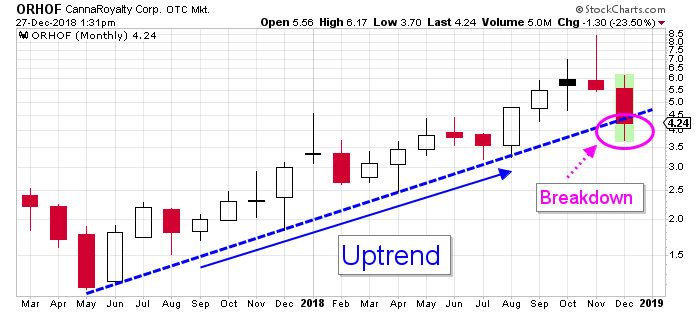
Chart courtesy of StockCharts.com
This stock chart illustrates that since CannaRoyalty stock bottomed at $1.15 in May 2017, a bullish trend has been in development.
This, like many other bullish trends that came before it, was characterized by price action consisting of a series of higher highs and higher lows.
Connecting the series of higher lows is how the uptrend line on the chart above was created. This simple metric captures the bullish trend by pinpointing where price support resides.
This level of price support was tested numerous times over the last 20 months, and each time, investors were always eager to jump in to support it. One could only assume that as long as ORHOF stock was trading north of this uptrend line that a bull market was in development, meaning the stock price would likely appreciate over time.
Price support defined by his metric resided at $4.35, but unfortunately, CannaRoyalty stock broke below this level of price support in December, which is normally a seasonality bullish period for stocks. This break below price support is suggesting that the bullish trend has run its course, opening the door for a potential bearish trend.
In order to negate these bearish implications, ORHOF stock will need to regain its footing above the uptrend line. This will not be an easy task, as the break below the uptrend line coincided with a break below the other metric that was acting like a level of support: the 200-day moving average.
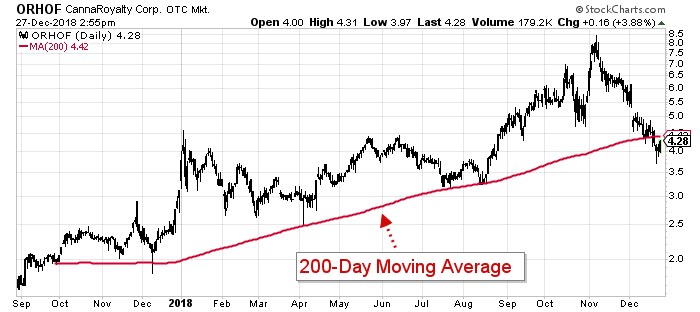
Chart courtesy of StockCharts.com
The 200-day moving average is a simple metric that acts as a dividing line, used to determine whether a stock is in a bullish or bearish state.
Trading above the 200-day moving average suggests the former, where one can expect higher stock prices to follow; trading below it implies the opposite.
As illustrated on the chart above, as soon as the 200-day moving average was established in late September, CannaRoyalty stock began trading above it. This was an indication that ORHOF stock was in a bullish state, and as expected, higher CannaRoyalty stock prices prevailed.
The 200-day moving average is a metric that is so widely followed that it has a habit of acting as a significant level of price support in a bull market and a major level of price resistance in bear markets.
That’s why it is not a coincidence that throughout the development of the bullish trend, the 200-day moving average served as support, much like the uptrend line.
In December, the selling pressure proved to much to overcome and ORHOF stock broke below the 200-day moving average. This event is now suggesting that CannaRoyalty stock is in a bearish state, meaning lower prices are likely to follow.
If my bearish assumption about ORHOF stock is going to ring true, then when the stock price tests the 200-day moving average from beneath, it should behave as price resistance. I will find out how accurate my prediction is soon enough, when the 200-day moving average is tested.
Analyst Take
CannaRoyalty stock has broken below coinciding levels of price support. These metrics have supported the stock while it was trending higher for the last 20 months, and breaking below them suggests that the bullish trend has finally run its course, opening the door for a bearish one.
As a result of these developments, I am no longer bullish on ORHOF stock.
MJ Shareholders
MJShareholders.com is the largest dedicated financial network and leading corporate communications firm serving the legal cannabis industry. Our network aims to connect public marijuana companies with these focused cannabis audiences across the US and Canada that are critical for growth: Short and long term cannabis investors Active funding sources Mainstream media Business leaders Cannabis consumers


No comments so far.
Be first to leave comment below.