
Juniper Stock Has Its Sights Set on Much Higher Stock Prices
Marijuana Business, Stocks, Finance, & Investing September 27, 2018 MJ Shareholders 0

JNPR Stock: Bullish on Multiple Time Frames
The use of technical analysis as a method of stock analysis to gauge the merits of an investment is a fickle subject. The reason why is that two technical analysts can look at the exact same stock charts and come up with completely different conclusions, even though the data is exactly the same.
In order to combat this potential dilemma, I like to use a number of charts and multiple time frames when gauging the merits of an investment. In order to generate a view on a stock, the technicals need to align on more than one time frame.
The time frames I like to use range from hourly, daily, weekly, and monthly time frames. The longer the time frame, the more emphasis is placed on the signal that is generated.
In order to illustrate this process, I am using Juniper Networks, Inc. (NYSE:JNPR) stock. Juniper stock has generated a number of bullish signals on multiple time frames, suggesting that JNPR stock is now poised for a move toward higher prices.
The first time frame I am focusing on is the weekly time frame, which is highlighted on the following Juniper stock chart.
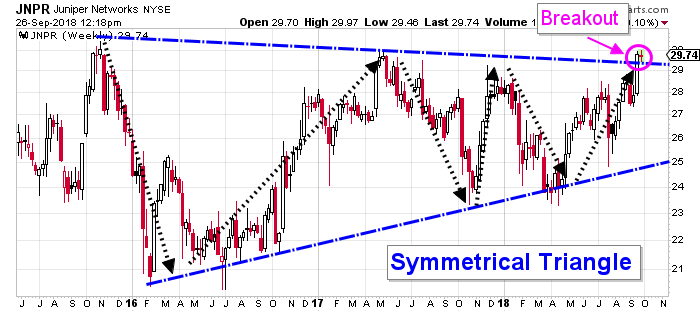
Chart courtesy of StockCharts.com
This weekly time frame captures the completion of a technical price pattern known as a symmetrical triangle.
Triangle patterns are created when the price action coils by creating a series of higher lows and lower highs. Triangle patterns that appear on a stock chart are identified by connecting the peaks and troughs created by the price action using simple trend lines. This process created the symmetrical triangle that is depicted on the Juniper stock chart above.
This coiling price action is very special because the inability to sustain a move toward higher or lower prices causes energy and momentum to build within the pattern. All this stored energy and momentum is released once the stock price exits the pattern. A sustained move in the direction that the pattern was resolved in is expected to follow.
As you can see on the chart above, Juniper stock has just broken above the trend line that represents price resistance. This suggests that the symmetrical triangle has been resolved and that a sustained move toward higher JNPR stock prices is expected to follow.
Even though a completed symmetrical triangle is a powerful price pattern and, therefore, a powerful indicator, the completed pattern itself is not enough to justify a bullish stance on JNPR stock.
This is why I have provided the following Juniper stock chart using a monthly time frame.
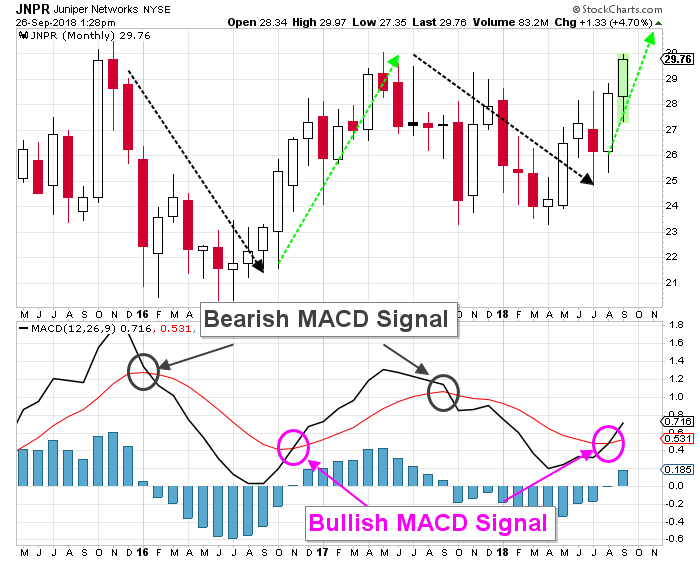
Chart courtesy of StockCharts.com
As you can see, this JNPR stock chart captures the same allotted time frame. The difference is that the data is plotted on the JNPR stock chart using monthly bars.
The reason why I chose this time frame is because a very influential momentum indicator known as the moving average convergence/divergence (MACD) indicator has just generated a bullish signal using this time frame.
The MACD indicator is captured in the lower panel on the chart above. This indicator determines whether the movement that is influencing the price action in a stock is bullish or bearish.
The information provided by this indicator is very significant because bullish momentum has a tendency to correctly suggest that a stock is likely to appreciate, while bearish momentum has a tendency to correctly suggest that a stock is likely to depreciate.
You don’t have to take my word for it; the examples highlighted on the Juniper stock chart clearly show this. When the MACD indicator generates a bullish signal, the Juniper stock price tends to appreciate. When the MACD indicator is on a bearish signal, the Juniper stock price tends to depreciate.
The MACD indicator has just generated a bullish signal, as recently as August, and it is suggesting that Juniper stock is likely to appreciate. This bullish signal reinforces the implications suggested by the completed symmetrical triangle, that higher JNPR stock prices are likely to prevail.
These indications are enough to suggest that a bullish stance is warranted, but I wanted to throw in one more price chart to capture the potential magnitude of the move that may follow.
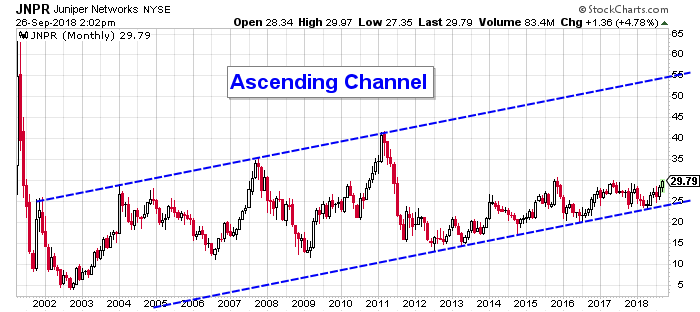
Chart courtesy of StockCharts.com
This Juniper stock chart illustrates that a very large technical price pattern known as an ascending channel has been in development since 2001.
An ascending channel is a pattern that captures a bullish trend. This pattern contains two upward-sloping trend lines that represent significant levels of price support and price resistance.
The theory surrounding this price pattern is that as long as the stock price is contained within it, higher stock prices will prevail over time.
Since July 2012, Juniper stock has been bouncing off support outlined by the ascending channel. The completed symmetrical triangle and the bullish MACD signal are suggesting that JNPR stock is ready to stage an advance within this price pattern.
Price resistance outlined by the ascending channel has not been tested since 2011, suggesting that perhaps a test is now long overdue. This level of resistance currently resides at $55.00. Due to its upward slope, the longer it takes to reach resistance, the higher the objective becomes.
Analyst Take
I believe that Juniper stock is now set to make a sustained move toward higher JNPR stock prices. My beliefs are based on a number of technical indications that have been generated using multiple time frames.
As a result of these indications, I will maintain a bullish view on Juniper stock until there are indications suggesting that a bullish view is no longer warranted.
MJ Shareholders
MJShareholders.com is the largest dedicated financial network and leading corporate communications firm serving the legal cannabis industry. Our network aims to connect public marijuana companies with these focused cannabis audiences across the US and Canada that are critical for growth: Short and long term cannabis investors Active funding sources Mainstream media Business leaders Cannabis consumers


No comments so far.
Be first to leave comment below.