
Hydrofarm Q2 Revenue Slips Sequentially 12% to $97.5 Million
FeaturedTrending Stories August 9, 2022 MJ Shareholders 0
Hydrofarm Holdings Group Announces Second Quarter 2022 Results
Company Reiterates Updated Full Year 2022 Outlook
SHOEMAKERSVILLE, Pa., Aug. 09, 2022 (GLOBE NEWSWIRE) — Hydrofarm Holdings Group, Inc. (“Hydrofarm” or the “Company”) (Nasdaq: HYFM), a leading independent manufacturer and distributor of branded hydroponics equipment and supplies for controlled environment agriculture (“CEA”), today announced financial results for its second quarter ended June 30, 2022.
Second Quarter 2022 Highlights vs. Prior Year Period:
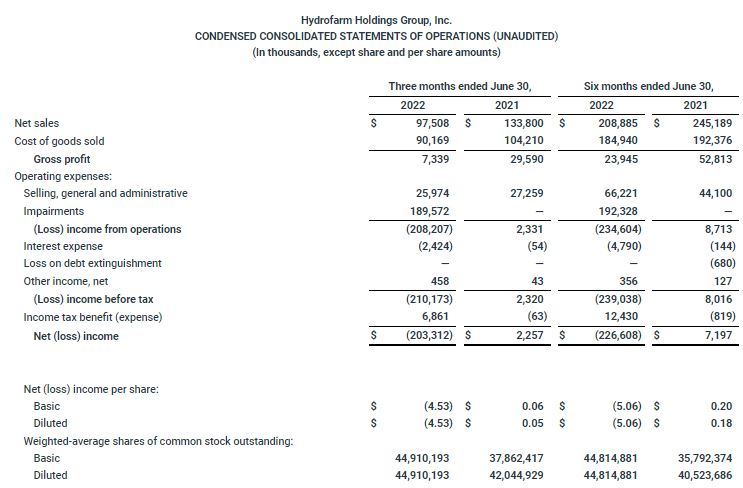
- Net sales decreased to $97.5 million compared to $133.8 million.
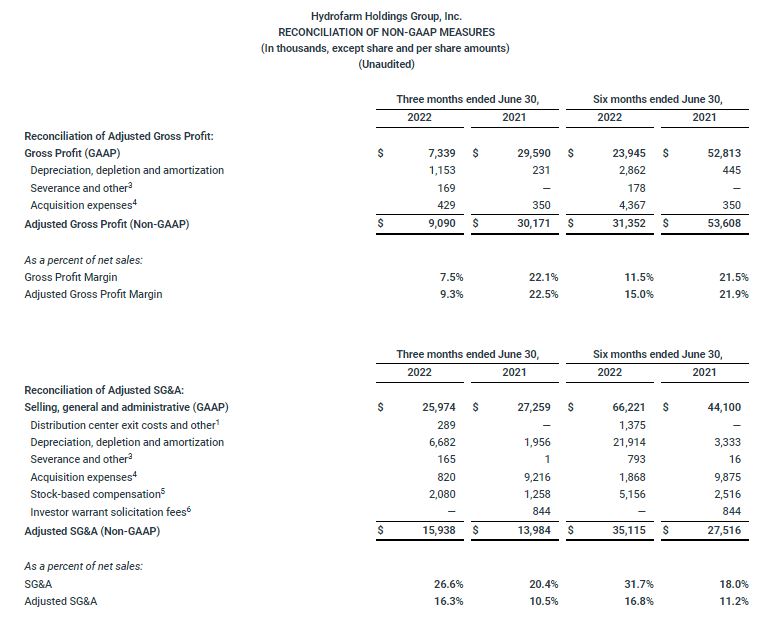
- Gross Profit decreased to $7.3 million compared to $29.6 million. Adjusted Gross Profit(1)(2) was $9.1 million compared to $30.2 million.
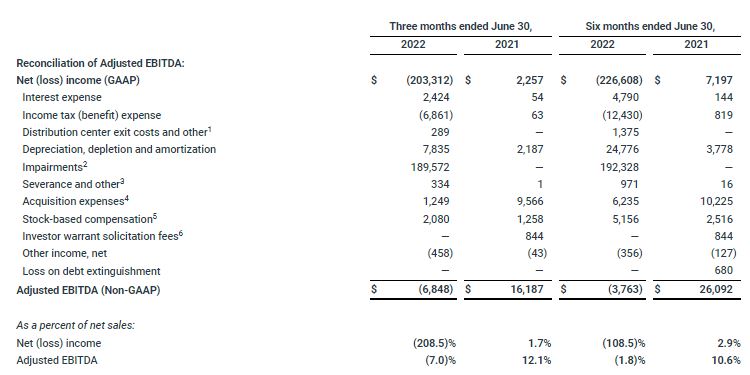
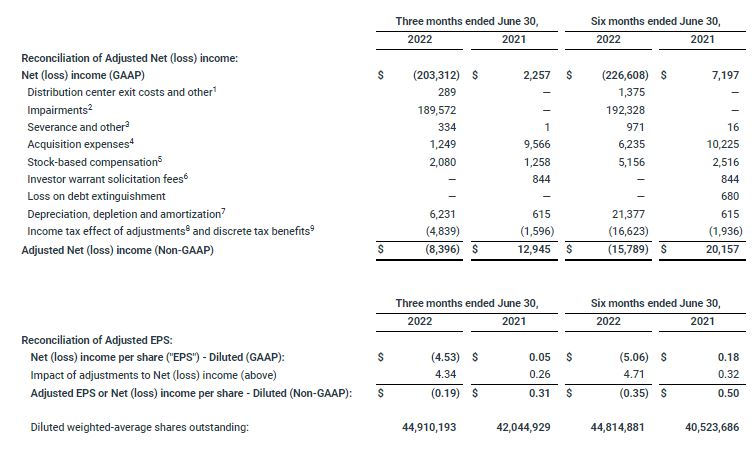
- Net loss was $(203.3) million, or $(4.53) per diluted share, compared to net income of $2.3 million, or $0.05 per diluted share. Net loss in the second quarter of 2022 included a non-cash charge of $189.6 million in goodwill impairment and a $10.2 million inventory reserve. Adjusted Net Loss(1)(2) was $(8.4) million, or $(0.19) per diluted share, compared to Adjusted Net Income(1)(2) of $12.9 million, or $0.31 per diluted share.
- The Company recorded a $10.2 million inventory reserve during the quarter, which was not treated as an adjustment. Adjusted EBITDA(1)(2) decreased to $(6.8) million compared to $16.2 million.
Full Year 2022 Outlook:
- Net sales of approximately $330 million to $347 million.
- Adjusted EBITDA(1)(2) of $(25) million to $(16) million.
(1) Adjusted Gross Profit, Adjusted Gross Profit Margin, Adjusted Net (Loss) Income, Adjusted EPS, Adjusted SG&A, Adjusted SG&A as a percent of net sales, and Adjusted EBITDA are non-GAAP measures. For reconciliations of GAAP to non-GAAP measures see the “Reconciliation of Non-GAAP Measures” accompanying the release.
(2) As a result of the $10.2 million inventory reserve, Adjusted Gross Profit, Adjusted Net (Loss) Income, Adjusted EPS, and Adjusted EBITDA were negatively impacted.
Bill Toler, Chairman and Chief Executive Officer of Hydrofarm, said, “Our second quarter results reflect the ongoing impact of the hydroponic industry recession in the U.S. and Canada. Nonetheless, we took positive steps to lower our cost structure and maintain a solid liquidity position.”
Despite the external challenges, the strength of Hydrofarm continues to be driven by the quality of our people and our brands. Additionally, we believe our strong consumable sales mix gives us insulation against further weakness in the category.
 Bill Toler, Chairman and Chief Executive Officer of Hydrofarm
We remain confident that the industry will eventually return to normalized growth, and the actions we are taking to refine our organization will leave our business leaner and stronger, and as a result, better positioned to take advantage of future growth opportunities.
Second Quarter 2022 Financial Results
Net sales in the second quarter of 2022 decreased to $97.5 million compared to the second quarter of 2021, driven by an approximate 29.9% decrease in volume of products sold, offset by an approximate 3.1% increase in price and mix of products sold, and an approximate 0.3% decline from unfavorable foreign exchange rates. The decrease in product volumes was primarily related to an agricultural oversupply, partially offset by a 13.5% benefit from recently acquired proprietary brands.
Gross profit decreased to $7.3 million, or 7.5% of sales, during the second quarter of 2022 was primarily due to the aforementioned decrease in net sales and a $10.2 million inventory reserve. Adjusted Gross Profit(1)(2) was $9.1 million or 9.3% of net sales, compared to $30.2 million or 22.5% in the second quarter of 2021. Adjusted gross profit margin(1)(2) was negatively impacted by a $10.2 million increase in inventory reserves primarily related to lighting products. During the second quarter of 2022, we experienced higher freight and labor costs, partially offset by pricing actions and a favorable sales mix of the Company’s proprietary brand products compared to the prior year period.
Selling, general and administrative (“SG&A”) expense was $26.0 million in the second quarter of 2022, or 26.6% of net sales, compared to $27.3 million in the second quarter of 2021, or 20.4% of net sales. The decrease in SG&A expense was primarily related to a reduction in acquisition expenses of $8.4 million, partially offset by higher depreciation, depletion and amortization expenses of $4.7 million. Adjusted SG&A(1)(2) increased to $15.9 million or 16.3% of net sales in the second quarter of 2022, compared to $14.0 million or 10.5% of net sales in the prior year period. The increase in Adjusted SG&A(1)(2) primarily relates to increases in compensation costs, facility costs, and insurance expenses. The added costs were largely the result of our distribution center expansions and the five acquisitions completed in 2021.
Net loss was $(203.3) million, or $(4.53) per diluted share, in the second quarter of 2022, compared to a net income of $2.3 million, or $0.05 per diluted share in the second quarter of 2021. Net loss for the second quarter of 2022 included a non-cash expense of $189.6 million in goodwill impairment and $10.2 million in inventory reserve. Excluding impairment and certain other adjustments, but not adjusting for the inventory reserve, Adjusted Net Loss(1)(2) was $(8.4) million, or $(0.19) per diluted share, in the second quarter of 2022, compared to Adjusted Net Income(1)(2) of $12.9 million, or $0.31 per diluted share, in the second quarter of 2021.
Adjusted EBITDA(1)(2) was $(6.8) million, or (7.0)% of net sales, for the second quarter of 2022, compared to $16.2 million, or 12.1% of net sales, in the second quarter of 2021. The decrease in Adjusted EBITDA(1)(2) was primarily related to lower gross profit due to a decline in net sales and an additional inventory reserve of $10.2 million.
Balance Sheet and Liquidity
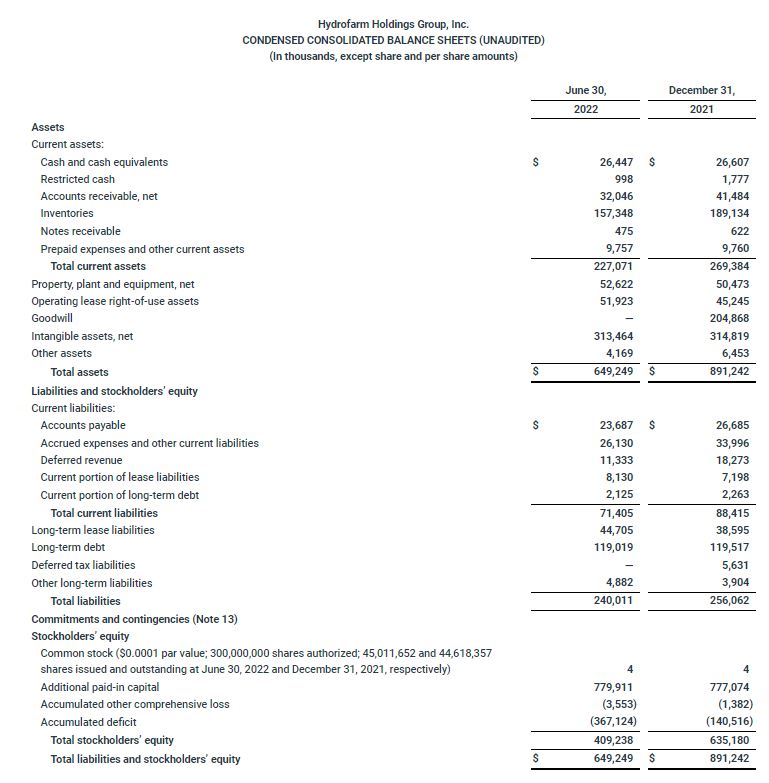
As of June 30, 2022, the Company had $27.4 million in cash, cash equivalents and restricted cash, an aggregate principal amount of debt outstanding of $126.7 million (including $0 drawn on the Company’s revolving credit facility, approximately $124.4 million in principal balance on its Term Loan and approximately $2.4 million in finance leases and other debt), $15.3 million in contingent payments (composed of an earn-out on the 2021 Aurora acquisition which was subsequently paid out in July 2022) and approximately $70 million of available borrowing capacity under its revolving credit agreement. The Company decreased its net debt by approximately $14.1 million during the second quarter by improving its working capital position and controlling costs. The Company was in compliance with all debt covenants as of June 30, 2022.
Full Year 2022 Outlook
The Company is reiterating its full year 2022 outlook, which was updated on August 2, 2022:
- Net sales of approximately $330 million to $347 million, which assumes similar sales levels to those experienced from late second quarter through July 2022 continue over the remaining months in the fiscal year, combined with some further reduction to account for holiday shortened months in the fourth quarter.
- Adjusted EBITDA(1)(2), which is impacted by $13.4 million of inventory reserves in the year-to-date period, of $(25) million to $(16) million, which assumes no further material increase in the amount of inventory or accounts receivable reserves.
The Company’s 2022 outlook includes the following updated assumptions:
- Capital expenditures of approximately $7.5 million to $9.0 million; and
- An estimated tax expense between $0 and $2 million for the full year, excluding the large discrete tax benefit of approximately $12 million recognized in the first half of 2022.
With respect to projected fiscal year 2022 Adjusted EBITDA, a quantitative reconciliation is not available without unreasonable effort due to the variability, complexity and low visibility with respect to certain items, including, but not limited to, impairment, certain potential future acquisition expenses, and the potential tax implications of these estimated expenses, all of which are excluded from Adjusted EBITDA. The Company expects the variability of these items to have a potentially unpredictable, and potentially significant, impact on its future GAAP financial results.
(1) Adjusted Gross Profit, Adjusted Gross Profit Margin, Adjusted Net (Loss) Income, Adjusted SG&A, Adjusted SG&A as a percent of net sales, and Adjusted EBITDA are non-GAAP measures. For reconciliations of GAAP to non-GAAP measures see the “Reconciliation of Non-GAAP Measures” accompanying the release.
(2) Adjusted Gross Profit, Adjusted Net Income and Adjusted EBITDA were negatively impacted, as a result of the inventory reserves of $10.2 million and $13.4 million, in the three and six months periods, respectively, ended June 30, 2022.
Conference Call
The Company will host a conference call to discuss financial results for the second quarter 2022 today at 4:30 p.m. Eastern Time. Bill Toler, Chairman and Chief Executive Officer, and John Lindeman, Chief Financial Officer, will host the call.
The conference call can be accessed live over the phone by dialing 412-317-6026. A replay will be available after the call until Tuesday, August 16, 2022 and can be accessed by dialing 412-317-6671. The passcode is 10168842. The conference call will also be webcast live and archived on the corporate website at www.hydrofarm.com, under the “Investors” section.
About Hydrofarm
Hydrofarm is a leading independent manufacturer and distributor of branded hydroponics equipment and supplies for controlled environment agriculture, including grow lights, climate control solutions, growing media and nutrients, as well as a broad portfolio of innovative and proprietary branded products. For over 40 years, Hydrofarm has helped growers make growing easier and more productive. The Company’s mission is to empower growers, farmers and cultivators with products that enable greater quality, efficiency, consistency and speed in their grow projects.
Notes to reconciliations presented above (Adjusted EBITDA, Adjusted Gross Profit, Adjusted SG&A, Adjusted Net (loss) income, and Adjusted Net (loss) income per share – Diluted):
- Relates to costs incurred to exit and relocate distribution centers in California and Pennsylvania including lease exit costs, transportation, and labor related costs.
- The Company completed its goodwill impairment testing and recorded an impairment charge of $189.6 million in the three months ended June 30, 2022, due to market softness in demand in the U.S. and Canada. During the quarter ended March 31, 2022, impairment primarily related to a $2.6 million charge associated with a note receivable that originated in 2019 associated with a third party independent processor serving the CBD market.
- Severance costs incurred during the three and six months ended June 30, 2022 related to workforce reductions to optimize our cost structure.
- For the three months ended June 30, 2022, this includes non-cash purchase accounting inventory adjustments for House and Garden and Greenstar $0.4 million, and the elimination of acquisition and integration consulting, transaction services and legal fees incurred for the completed Heavy 16, House and Garden, Aurora, Greenstar, and Innovative Growers Equipment acquisitions and certain potential acquisitions of $0.8 million. For the six months ended June 30, 2022 this includes non-cash purchase accounting inventory adjustments for House and Garden, Aurora, Greenstar and Innovative Growers Equipment $4.4 million, the elimination of acquisition and integration consulting, transaction services and legal fees incurred for the completed Heavy 16, House and Garden, Aurora, Greenstar, and Innovative Growers Equipment acquisitions and certain potential acquisitions of $3.4 million, partially offset by the change in fair value of contingent consideration for Aurora of ($1.6 million).
- Includes stock-based compensation and related employer payroll taxes on stock-based compensation for the periods presented.
- Reflects the elimination of one-time investor warrant solicitation fees.
- Depreciation, depletion and amortization increased significantly over the prior year due primarily to several acquisition related purchase-accounting adjustments impacting the three and six months ended June 30, 2022. For purposes of computing adjusted net (loss) income for the quarter ended June 30, 2022, the Company is including the impacts from 2021 acquisitions for comparability to the prior year, including the significant amortization and depreciation expense relating to these acquisitions.
- Reflects the income tax effect related to adjustments to net (loss) income at the normalized tax rate of 13%, which reflects an estimated tax rate based on the nature of these adjustments. The impairments recorded during the six months ended June 30, 2022 are excluded from these income tax effects as income tax benefits are presented discretely.
- For the three and six months ended June 30, 2022, the Company recorded discrete income tax benefits of approximately $3.5 million and $12.1 million, respectively, relating to measurement period adjustments associated with 2021 acquisitions, which were primarily recorded in the first quarter, and certain tax benefits related to goodwill impairment in the second quarter.
Non-GAAP Financial Measures
We report our financial results in accordance with generally accepted accounting principles in the U.S. (“GAAP”). Management believes that certain non-GAAP financial measures provide investors with additional useful information in evaluating our performance and that excluding certain items that may vary substantially in frequency and magnitude period-to-period from net (loss) income provides useful supplemental measures that assist in evaluating our ability to generate earnings and to more readily compare these metrics between past and future periods. These non-GAAP financial measures may be different than similarly titled measures used by other companies.
To supplement our condensed consolidated financial statements which are prepared in accordance with GAAP, we use “Adjusted EBITDA”, “Adjusted Gross Profit”, “Adjusted SG&A”, “Adjusted Net (loss) income”, and “Adjusted Net (loss) income per diluted share” or “Adjusted EPS” which are non-GAAP financial measures. Our non-GAAP financial measures should not be considered in isolation from, or as substitutes for, financial information prepared in accordance with GAAP. There are several limitations related to the use of our non-GAAP financial measures as compared to the closest comparable GAAP measures. Some of these limitations include:
We define Adjusted EBITDA as net (loss) income excluding interest expense, income taxes, depreciation, depletion, and amortization, share-based compensation, employer payroll taxes on share-based compensation and other non-cash, unusual and/or infrequent costs (i.e., impairment, restructuring and other expenses, acquisition-related expenses, distribution center exit costs, loss on debt extinguishment and other income, net), which we do not consider in our evaluation of ongoing operating performance.
We define Adjusted EBITDA as a percent of net sales as adjusted EBITDA as defined above divided by net sales realized in the respective period.
We define Adjusted Gross Profit as gross profit excluding depreciation, depletion, and amortization, and other non-cash, unusual and/or infrequent costs (i.e., impairment, restructuring and other expenses, and acquisition-related expenses), which we do not consider in our evaluation of ongoing operating performance.
We define Adjusted SG&A as SG&A excluding depreciation, depletion, and amortization, and other non-cash, unusual and/or infrequent costs (i.e., impairment, restructuring and other expenses, acquisition-related expenses, share-based compensation, employer payroll taxes on share-based compensation, and distribution center exit costs), which we do not consider in our evaluation of ongoing operating performance.
We define Adjusted Net (loss) income as net (loss) income excluding adjustments to stock-based compensation and employer payroll taxes on stock-based compensation, and certain other non-cash, unusual and/or infrequent costs including those relating to our five acquisitions in 2021 (i.e., Depreciation, depletion and amortization related to acquisitions, impairment, restructuring and other expenses, acquisition-related expenses, loss on debt extinguishment, and distribution center exit costs), which we do not consider in our evaluation of ongoing operating performance, and the income tax impact resulting from the above adjustments to net (loss) income.
We define Adjusted Net (loss) income per share – Diluted or Adjusted EPS as adjusted net (loss) income as defined above divided by the weighted average diluted shares outstanding.
The Company defines net debt as total debt principal outstanding less cash, cash equivalents and restricted cash.
 Get ahead of the crowd by signing up for 420 Investor, the largest & most comprehensive premium subscription service for cannabis traders and investors since 2013.
MJ Shareholders
MJShareholders.com is the largest dedicated financial network and leading corporate communications firm serving the legal cannabis industry. Our network aims to connect public marijuana companies with these focused cannabis audiences across the US and Canada that are critical for growth: Short and long term cannabis investors Active funding sources Mainstream media Business leaders Cannabis consumers


No comments so far.
Be first to leave comment below.