
Facebook Stock Is Broken, Further Downside Expected
Marijuana Business, Stocks, Finance, & Investing October 27, 2018 MJ Shareholders 0

FB Stock: Bearish Pressure Is Mounting
The markets are in shambles, and the infamous “FANG” stocks that have been the poster children for the bull market are beginning to crumble. The fact that these pillars of support have begun to fall is putting the entire bull market into question.
I have chosen to focus on Facebook, Inc. (NASDAQ:FB) stock because I have reason to believe that it has put in a significant top, and that a correction is now unfolding.
My beliefs stem from a number of technical indications that are currently suggesting that Facebook stock is now geared toward lower prices.
The first indication that FB stock is no longer geared toward higher prices is captured on the following chart.
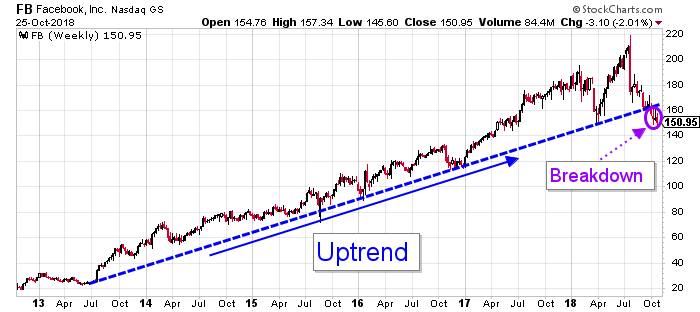
Chart courtesy of StockCharts.com
This stock chart illustrates an immaculate bullish trend that has been in development since June 2013. It has been responsible for taking FB shares from a low of $22.67 to a high of $218.62, representing an 864.4% return from trough to peak.
I captured this bullish trend using a simple trend line. Creating this trend line was accomplished by simply connecting the series of higher lows that characterized this bullish trend.
Using the uptrend line is just as simple as it was to create. As long as the stock price is trading north of it, I can only assume that a bullish trend is in development and that, therefore, higher stock prices will prevail over time. Breaking below it, on the other hand, would negate these bullish implications.
On October 8, Facebook stock was unable to maintain its footing above the uptrend line as the selling pressure proved to be too much to overcome. This event, marked as a breakdown on the chart above, was the first time that that the stock sustained a close below the trend line that has been supporting the stock price for the last five years.
This event is suggesting that that the bullish trend toward higher prices is no longer in development, opening the door for further losses.
This breakdown below the uptrend line was not the first indication suggesting that the bullish trend was coming to an end. An unconfirmed high and an influential momentum indicator highlighted on the following chart were already warning of such an outcome.
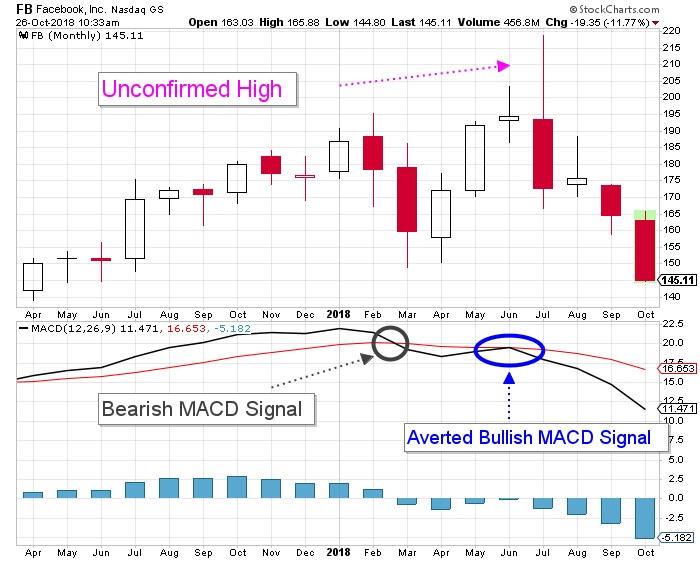
Chart courtesy of StockCharts.com
The stock chart above illustrates that in February of this year, a bearish moving average convergence/divergence (MACD) signal was generated.
To clarify, MACD is a simple, yet effective indicator that uses the crossing of a signal line to distinguish whether bullish or bearish momentum is influencing the price action in a stock. Bullish momentum implies that a stock is likely to advance, while bearish momentum implies that a stock is likely to decline.
The bearish MACD signal generated in February suggested that momentum was favoring lower Facebook stock prices.
For the next two months, lower prices did prevail, but then FB stock found its footing and began staging an advance. By June, Facebook shares had reached a new high, and further gains followed in July.
Here is the thing about momentum: a stock cannot sustain a move in either direction unless the applicable level of momentum is supporting it. The new highs that were generated in June and July were not accompanied by the applicable bullish momentum, which is why the new highs are labeled as unconfirmed.
In fact, the MACD signal lines did make a valiant attempt to cross in July, but selling pressure quickly overwhelmed FB stock, and a bullish MACD signal was averted.
This inability to generate a bullish MACD signal is in itself a very powerful indication. Not only did it not confirm the new highs that were created, but it also suggests that bears have firm control over the trading action in Facebook stock, which is why it wasn’t a total surprise that the uptrend line broke soon after.
The FB stock price is now approaching a level of price support that resides at $149.00. It was first established in March of this year, and is currently being tested. My fears are that this level of price support will fall, which will unleash another round of selling pressure, driving the price even lower.
Analyst Take
I am bearish on Facebook stock because a number of technical indications are suggesting that the FB stock is currently geared toward lower prices.
I will maintain this bearish view until there are indications that suggest otherwise.
MJ Shareholders
MJShareholders.com is the largest dedicated financial network and leading corporate communications firm serving the legal cannabis industry. Our network aims to connect public marijuana companies with these focused cannabis audiences across the US and Canada that are critical for growth: Short and long term cannabis investors Active funding sources Mainstream media Business leaders Cannabis consumers


No comments so far.
Be first to leave comment below.