
Ambarella Stock Is in Danger of Breaking Below Price Support
Marijuana Business, Stocks, Finance, & Investing October 11, 2018 MJ Shareholders 0

AMBA Stock: Path of Least Resistance Is Geared Toward Lower Prices
Ambarella Inc (NASDAQ:AMBA) has fallen on hard times in recent years. Its severed relationship with GoPro Inc (NASDAQ:GPRO) has put a dent into its sales figures. The company is finding it tough to grow as year-over-year sales comparisons continue to decline.
I am having a hard time forming a bullish case for this company because I am finding it difficult to find a catalyst that will reinvigorate growth in AMBA stock once again. That being said, a company that is not growing rarely ever translates into a higher stock price.
This is why I am currently concerned about the prospects of Ambarella stock going forward. My concerns are being reinforced by the technical backdrop that continues to suggest that AMBA stock is geared for lower prices.
At this moment, the stock price is testing a very important and significant level of price support. This level of price support is highlighted on the following Ambarella stock chart.
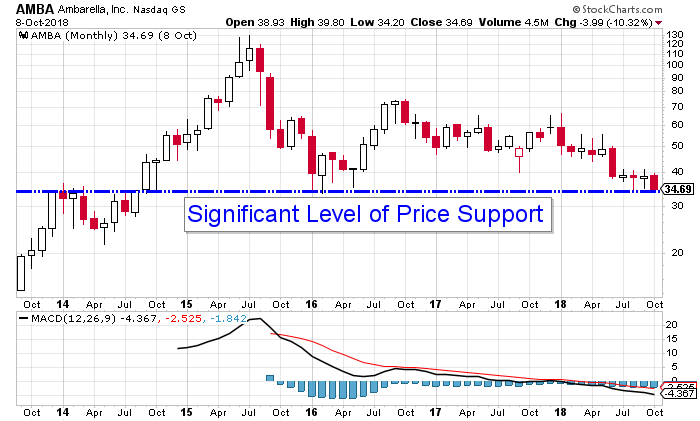
Chart courtesy of StockCharts.com
The significant level of price support highlighted on the AMBA stock chart resides at $34.00.
It was first established as an important price point in December 2013, where it acted as a significant level of price resistance. It acted as a level of price resistance until September 2014, when the price finally broke above it.
As is usually the case, when a significant level of price resistance is finally broken, it becomes a new level of price support. True to its nature, since that fateful day in September 2014, $34.00 has become and remains a very important and significant level of price support.
I have the inclination to believe that this significant level of price support is going to give in the not-too-distant future. If this event does occur, much lower AMBA stock prices are likely to follow, for the simple reason that many have placed their stop-losses at or just below this level.
As I mentioned earlier, aside from the poor fundamentals, the technical backdrop continues to suggest that the path of least resistance for Ambarella stock is geared toward lower prices, which increases the odds that price support at $34.00 will fall.
The technical signals creating the bearish backdrop are captured on the following Ambarella stock chart.
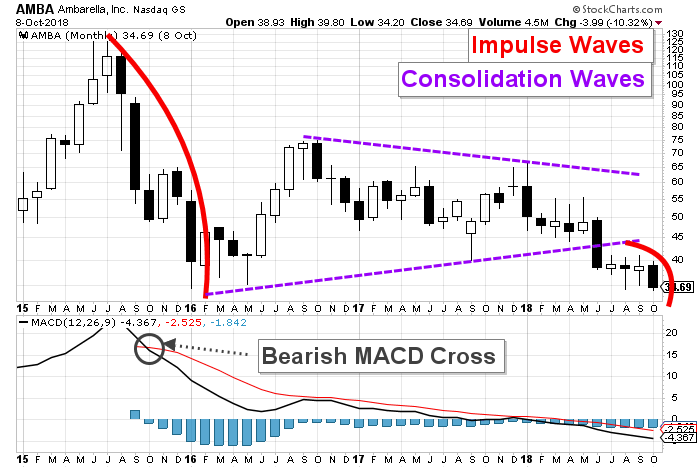
Chart courtesy of StockCharts.com
This AMBA stock chart above has been annotated in order to highlight an alternating wave structure.
The wave structure consists of two predominant waves: an impulse wave and a consolidation wave. These waves are responsible for creating and sustaining the bearish trend currently in development.
The initial wave, which is highlighted in red on the chart above, is an impulse wave. Impulse waves capture the stage in a bearish trend when a stock sustains a progressive move toward lower prices.
The wave that follows, which is highlighted in purple, is a consolidation wave. Consolidation waves capture the stage in a bearish trend where the stock price bounces and refrains from further declines. Consolidation waves are counter-trend moves that set up the wave that follows.
In June, AMBA stock exited the consolidation wave in a downward direction, suggesting that a new sustained leg toward lower prices had begun.
This suggestion continues to be supported by the moving average convergence/divergence (MACD) indicator located in the lower panel of the stock chart above.
MACD is a very influential momentum indicator that uses the crossing of a signal line to distinguish whether bullish or bearish momentum is influencing the price action in a stock. Momentum is a force to be reckoned with, which is why any sustained moves in price need to be accompanied by applicable levels of momentum.
This is why this indicator has a propensity to confirm whether a bullish or bearish trend is in development.
In September 2015, a bearish MACD signal was generated, suggesting that the path of least resistance was geared toward lower prices. The signal lines that create this indication have remained in bearish alignment, which continues to support the notion that lower Ambarella stock prices are likely to prevail.
Analyst Take
A number of technical indicators are currently suggesting that Ambarella stock is likely to break below a significant level of price support, opening up the door for lower AMBA stock prices to follow.
MJ Shareholders
MJShareholders.com is the largest dedicated financial network and leading corporate communications firm serving the legal cannabis industry. Our network aims to connect public marijuana companies with these focused cannabis audiences across the US and Canada that are critical for growth: Short and long term cannabis investors Active funding sources Mainstream media Business leaders Cannabis consumers


No comments so far.
Be first to leave comment below.